Are we on track? One screen, thirty seconds.
The demo runs entirely in your browser on a synthetic dataset — invented companies, invented people, a permanent Demo data badge. Nothing is sent anywhere. It is one self-contained file of about 5 MB, so it is best opened on a laptop.
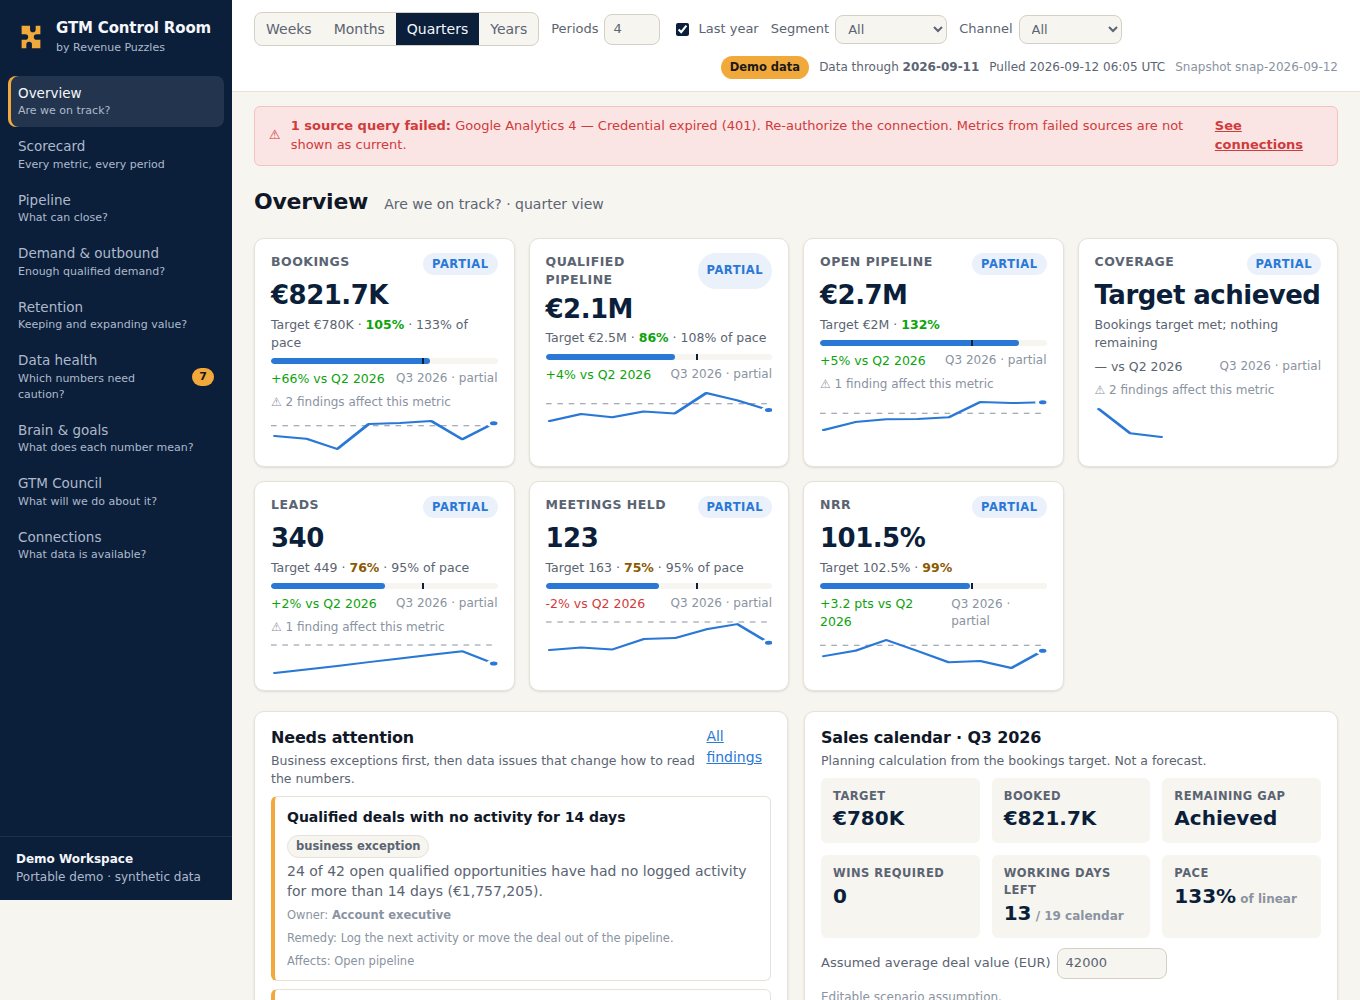
What you can do in it
- Switch Weeks / Months / Quarters / Years and toggle last year — comparisons are cut to the same elapsed days.
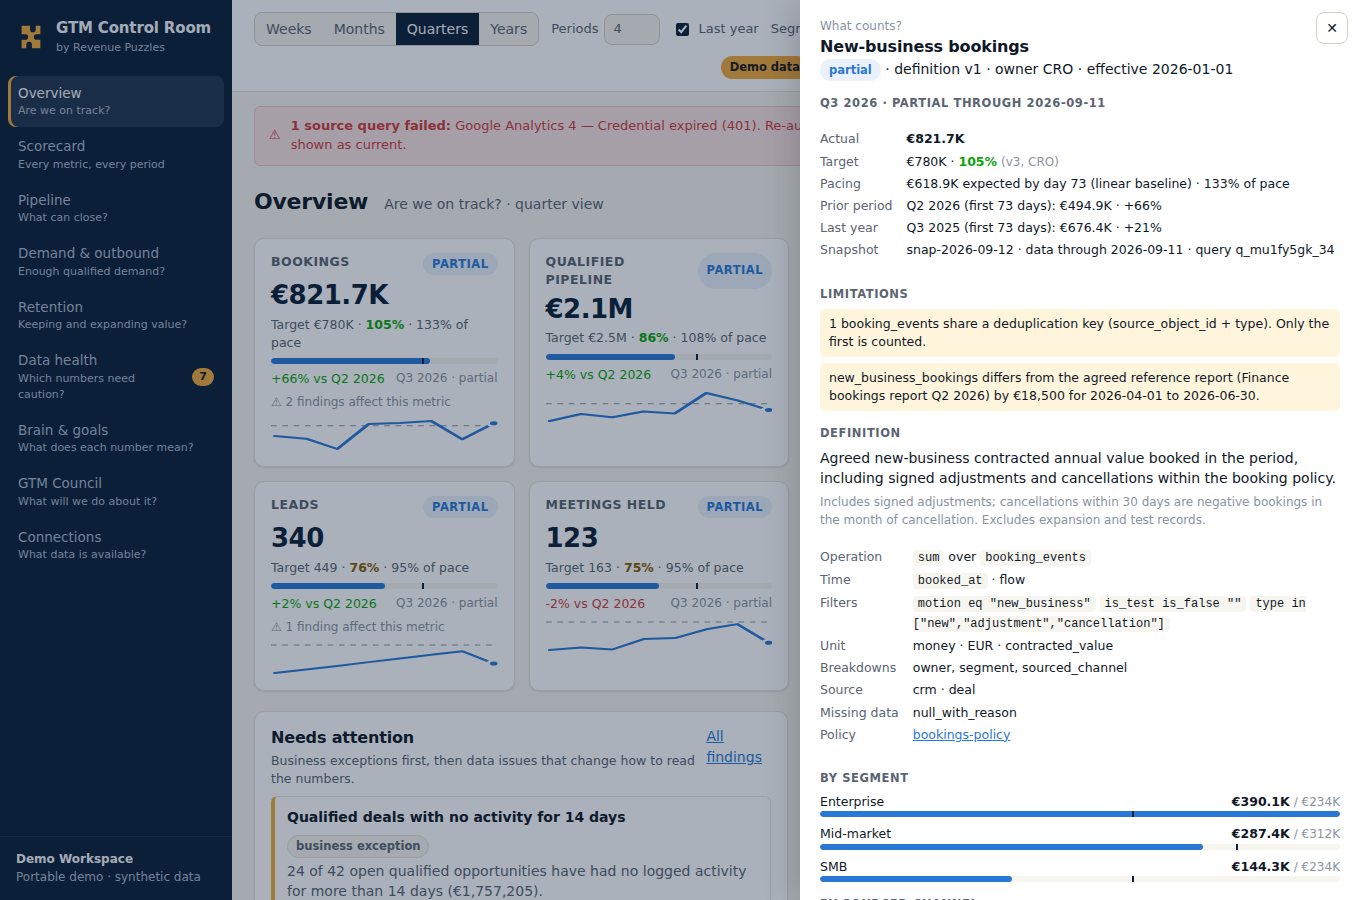
- Open What counts? behind any number: definition, version, owner, limitations, supporting records.
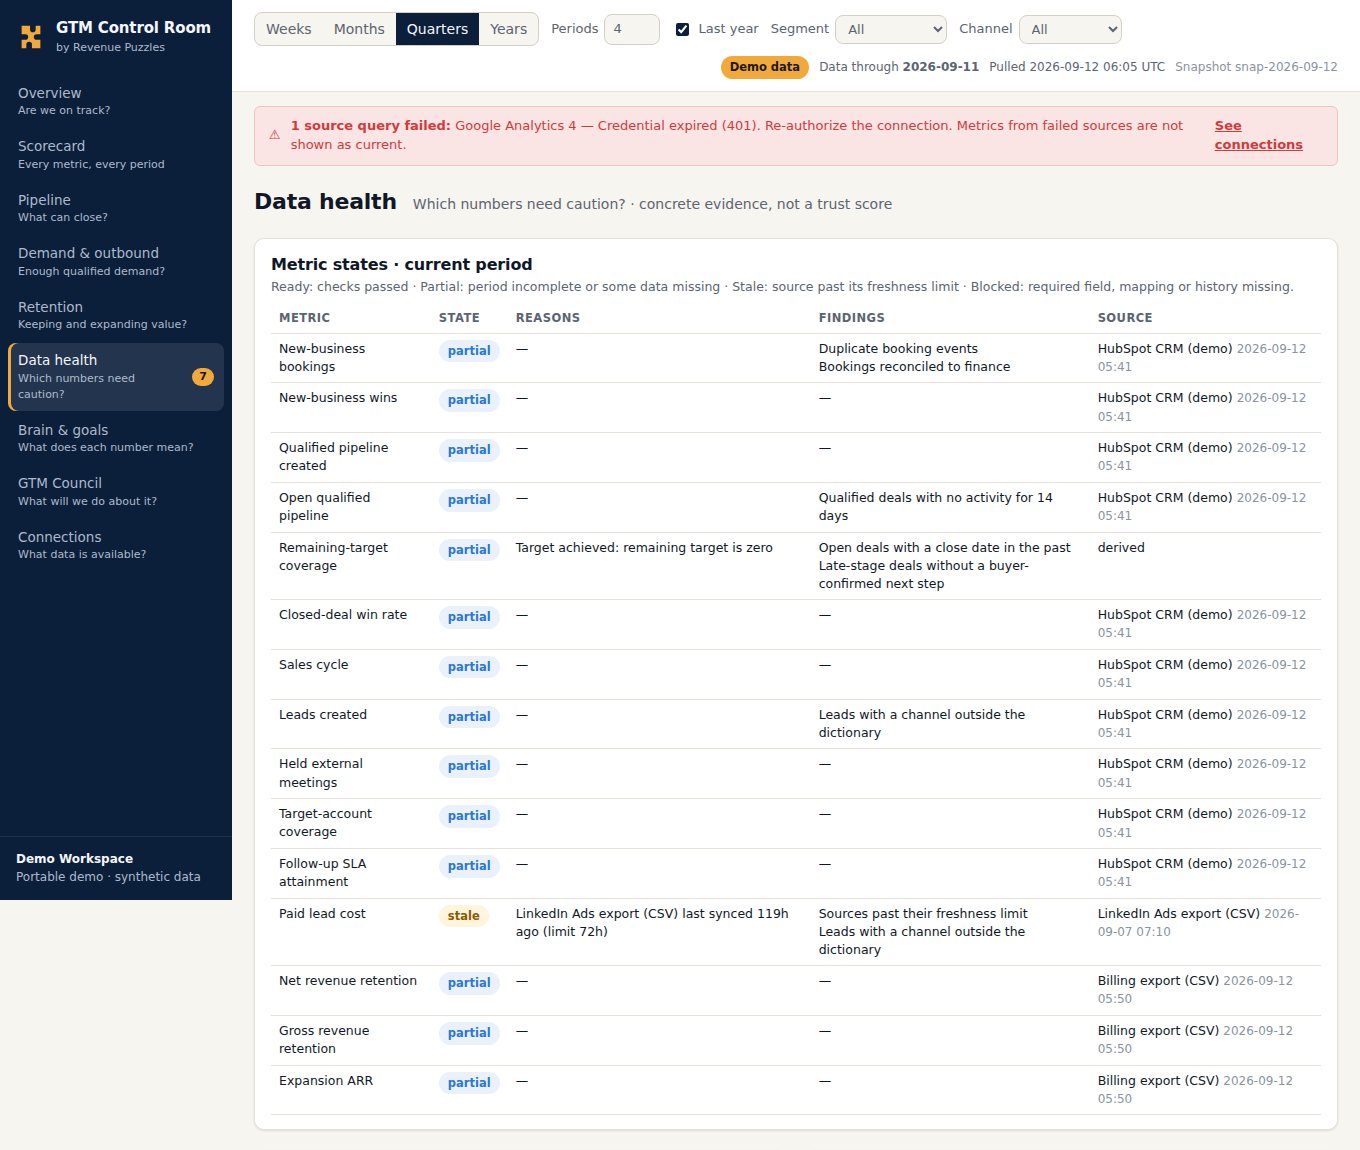
- See a data-quality issue and its consequence on Data health — including a failed GA4 credential and a stale ads export.
- Change the assumed deal value on the sales calendar and read the required pace.
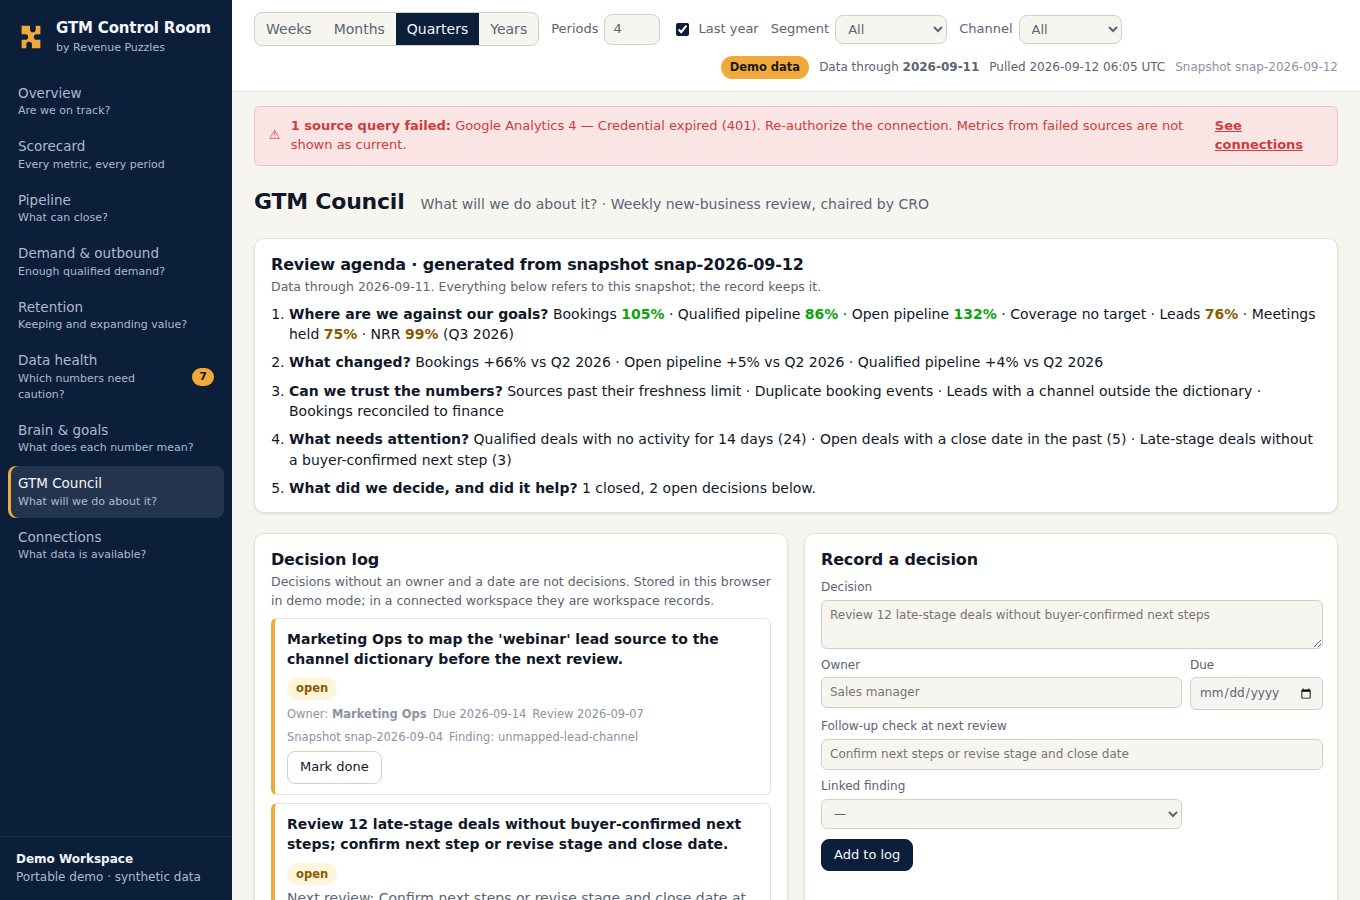
- Generate the review agenda from the snapshot and record a decision with an owner and a due date.
- Export a configuration starter from Brain & goals to begin your own workspace.
Read it in thirty seconds
Three screens carry most of the value. Each is a real view from the demo, not a mock-up.
What makes it different
Most dashboards show numbers. This one shows numbers and the case for believing them. Three properties do most of the work:
A definition behind every number
Each metric is a JSON definition using approved operations only — population filters, time behaviour, unit, source, owner, version. The drawer shows it; the engine computes from it; nothing else does arithmetic.
A number nobody can explain is a number nobody trusts.Unavailable is not zero
Missing data, a zero denominator, a blocked capability: the result is null with a reason, shown as Unavailable or Blocked. Coverage with nothing left to close says "Target achieved", never infinity.
A failed source stays visible — never hidden behind a stale number.Decisions tied to snapshots
A review keeps the snapshot it looked at. Decisions carry an owner, a due date and a follow-up check written at the time. Outcomes are recorded before the next review.
No new numbers in the room — disputed figures become data issues.The ten non-negotiables
These hold in every phase of the build. A session may not trade them for speed — they are written into the repository's standing brief and into the decision records.
| # | Rule | What it prevents |
|---|---|---|
| 01 | One source per metric; overlaps need an explicit precedence rule. | Two systems disagreeing about the same number. |
| 02 | All arithmetic in one deterministic engine. No numbers computed in the UI, the analyst or by a model. | Cards, scorecard and analyst drifting apart. |
| 03 | A definition is configuration, not code: approved operations and declarative filters only. | An uploaded document silently rewriting a live calculation. |
| 04 | Unavailable is null with a reason, never 0. | A broken feed reading as a collapse in bookings. |
| 05 | Every result carries query id, snapshot id, definition version, coverage and comparison windows. | A figure on a slide nobody can trace. |
| 06 | Point-in-time values come from history or snapshots, never today's values. | Last quarter's pipeline quietly rewritten by this week's edits. |
| 07 | Re-imports and retries never inflate totals — dedup keys are declared. | Double-counted bookings after a sync retry. |
| 08 | Failures are visible on the page. | A stale number presented as current. |
| 09 | Targets come from the goals sheet the leadership team edits; scope must match exactly. | A segment filter silently compared against the company-wide target. |
| 10 | Credentials only on the server; demo data is invented; no client data in the repository. | A token in the browser, or a real account in a public repo. |
"Ask the analyst" answers five approved questions — Why are we behind target? What changed? Can we trust this number? Where is the gap by segment and channel? What needs attention this week? — from the same engine output the cards show. It never computes a figure of its own. Ask it to convert MRR to ARR and it declines, naming the guardrail: that conversion is not a defined metric. A model-backed version, when it comes, reads the same evidence bundle and may only rephrase and prioritise; any number it outputs must already exist in the bundle.
What is inside
Nine views, one question each
| View | The question it answers | What is on it |
|---|---|---|
| Overview | Are we on track? | Headline cards, needs-attention list, sales calendar, open decisions, analyst |
| Scorecard | Every metric, every period | Sections × periods; partial markers; year-over-year on elapsed days; footnotes |
| Pipeline | What can close, what needs attention? | Open and created pipeline by period, segment, channel, stage; deal inspection with flags |
| Demand & outbound | Enough qualified demand? | Leads, meetings, target-account coverage, follow-up SLA, paid lead cost, campaigns |
| Retention | Retaining and expanding value? | NRR and GRR against target, expansion, movements |
| Data health | Which numbers need caution? | Metric-state matrix, data issues, business exceptions with records |
| Brain & goals | What does each number mean? | Metric dictionary, targets, process and channel dictionaries, policies, proposals, export |
| GTM Council | What will we do about it? | Generated agenda, decision log, record a decision |
| Connections | What data is available? | Source status, freshness, coverage, capability matrix, failed-query alert |
Fifteen governed metrics — the subscription new-business pack
| Metric | Foundation | Section |
|---|---|---|
| New-business bookings | Agreed new-business contracted value in the booking period, per the bookings policy | New business |
| New-business wins | Qualified new-business opportunities closed won | New business |
| Qualified pipeline created | Value at first entry into the approved qualified stage | New business |
| Open qualified pipeline | Eligible open value at the selected snapshot — point in time | New business |
| Remaining-target coverage | Eligible pipeline due in the window ÷ remaining bookings target | New business |
| Closed-deal win rate | Qualified wins ÷ qualified wins plus losses closed in the period | New business |
| Sales cycle | Median days qualification → win, won population | New business |
| Leads created | Non-test leads created, all channels | Demand |
| Held external meetings | Distinct completed meetings meeting the external-attendee rule | Demand |
| Target-account coverage | Target accounts with qualifying activity ÷ eligible target accounts | Demand |
| Follow-up SLA attainment | Leads followed up within the window ÷ eligible leads | Demand |
| Paid lead cost | Campaign spend ÷ paid-channel CRM leads | Demand |
| Net revenue retention | Opening cohort after expansion, contraction and churn ÷ opening | Retention |
| Gross revenue retention | As NRR without expansion | Retention |
| Expansion ARR | Recurring revenue added by existing customers | Retention |
Every definition is built from eight approved operations — the only executable vocabulary:
Adding an operation is an engine change with tests, a schema change and a decision record. It is never done from a document upload. Rates are recalculated from underlying counts, never averaged; pipeline snapshots are never summed; bookings, revenue, ARR and cash stay separate value bases.
Quarter target €300,000; booked to date €180,000 → remaining €120,000. Open qualified pipeline with a close date inside the quarter €360,000 → coverage 3.0×. Deals without a close date are excluded and listed on Data health. If booked ≥ target: "Target achieved". The sales calendar at an assumed €40,000 per win shows three additional wins required, against the remaining calendar and working days — a planning calculation, not a forecast.
Run it on your data
Node 20 or later. No dependencies, no build step. Sixty seconds to the demo; an afternoon to a first view of your own exports.
Three steps to your own workspace
- Export. Pull deals, deal history, companies, contacts and engagements from your CRM; campaign spend from ads; movements from billing. Put them in
fixtures/<workspace>/following the data model. - Map. Copy
config/workspaces/demo/— or use Brain & goals → Export starter — and edit the workspace profile, the metric definitions,targets.csv, the channel dictionary, process definitions and inspection rules.npm run validatechecks every file against its schema. - Review. Point the app at the workspace and run. The first Monday: read the Overview, open the drawer on anything surprising, fix what Data health lists, record the decisions.
Portable now, connected next
Working today — portable mode
- Engine: ISO weeks, fiscal quarters, partial windows, eight operations, targets with exact scope, pacing, prior and prior-year on equivalent elapsed days — 29 tests, green.
- Quality: nine check types; data issues separated from business exceptions.
- Analyst v1: five approved questions; declines undefined calculations.
- Nine views, drawer, filters, grain switcher, states, failed-source banner, sales calendar, decision log, configuration export.
- Static single-file build that renders and computes identically.
Skeleton — the connected pilot
- HubSpot adapter: server-side only; probes stage, amount and close-date history at discover; Monday pipeline snapshots; a failed run never partial-commits.
- Cloudflare Worker + D1 + R2 behind the same eight endpoints the dashboard already uses, so the UI does not change between modes.
- Import UI with a mapping editor and preview on the Connections view.
- Sign-in with domain restriction; reviews and decisions as server records with an audit log.
The contracts for all of it — sockets, adapters, API, security, testing — are written in docs/. A source can change without the dashboard changing; that is the point of the socket layer.
Built in the open
The repository is both the implementable specification — seventeen documents, five JSON schemas, ten locked decision records, a build checklist — and the working portable version. It is written so a Claude Code session or a human engineer can pick it up cold and build the next phase without asking what "qualified pipeline" means.
Every session follows the same standing brief: read the status document, pick the next unchecked item, meet its acceptance condition, verify it the way finance would, update the status. Discovered work becomes a new checklist item, never a quietly widened one.
Where the checklist stands
Counts from docs/build-checklist.md at the time of writing; the repository's STATUS.md is the live version.
Reporting is where GTM engagements go quiet: everyone agrees the numbers matter, nobody can say which definition produced them. Publishing the engine, the dictionary and the decisions makes the argument inspectable — and lets a client's RevOps team own the result rather than rent it.
What it does not do yet
- Portable mode reads static files; there is no import UI yet (the CSV adapter exists as a module).
- Decisions recorded in the demo live in your browser only.
- The HubSpot adapter and the Worker are skeletons with contracts and TODOs; there is no server-side authorisation yet.
- Coverage can inflate when the remaining target is small — the remaining amount is shown next to the ratio so it is read with the gap.
- Forecasting models, attribution beyond sourced/influenced, free-form AI questions over raw records and multi-currency consolidation are out of scope for the pilot.
The demo dataset is generated by a seeded script with deliberate data-quality cases (a duplicate booking, an expired credential, a stale export, unmapped channels). No client data exists anywhere in the repository. MIT licence © Revenue Puzzles.
The reporting contract — definitions, ownership, goals — is agreed in a workshop before anything is built; the portable version then runs on your exports within days. Tell me what is going on and I will say whether it fits.